

|
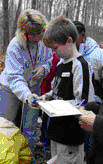
Probing Questions On a brisk, overcast day a busload of budding scientists embarked on a field trip to Spruce Run Environmental Education Center. Spruce Run is located on 50 acres of land donated to Columbus Public Schools by Robert and Dorothy Patton in 1974. It is well suited for outdoor education with a variety of geologic features, including a succession plot, woodland, meadow, shale creek bed, flood plain, and ridge. A portable classroom equipped with electricity and running water serves as a shelter and area for indoor activities. As the students emerged from the bus, the air was filled with excitement and anticipation. This was no ordinary field trip. These urban scientists were going to collect data with science probes that would help them find the answers to questions posed about the differences in the ecosystems of a stream, forest, and meadow. Which type of soil supports more plant life? Why do you think the habitats have different pH levels in the soil? Are there different temperature readings among the ecosystems? After being divided into groups, students were given worksheets (see side bar) and rotated through stations where they learned about the characteristics of ecosystems, soil pH, difference between air and ground temperatures, and how to use probes. Laptop computers were set up in the shelter house to manipulate the information. Prior to this scientific expedition, students were prepped with background information on habitats, pH, making predictions, and soil composition. Websites provided valuable background information and contributed to the prior knowledge necessary for scientific inquiry. |
|||||||||
 |
Prerequisite Skills/Knowledge - Surprising Soil Students should have an understanding of pH and make predictions based upon their prior knowledge and experiences. Different soil types (different varieties of plant life that, in turn attracts and supports different types of animals. The pH of the soil can dictate what types of vegetation and animals inhabit a particular area. pH measures whether something is an acid or alkaline, or neutral. If the pH is 7, it is neutral; if the pH is above 7, it is alkaline; and if it is below 7, it is acid. pH levels in the range of 0-4.0 are typically too acidic for most plants; 6.0-8.0 is the range most plants do best; 8.5-14 is too alkaline for most plants. Below are examples of pH levels preferred by certain plants:
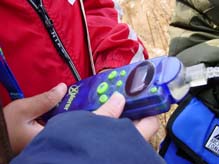
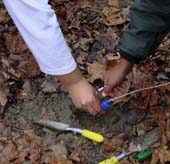
Students should have a deep understanding of soil composition and characteristics. McGraw-Hill Science Text, pp. 434-437 Students should have an understanding of the use of magnifying lenses, coffee cans as core samplers, filtering containers, measuring in ml, stop watches, and litmus or pH indicators such as probes. |
|||||||||
|
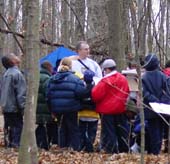
Field Trip During the field trip to an outdoor area, have students pair up and rotate through three stations: Forest, Stream, and Meadow. Use the Soil Sample Worksheet or the Probe Worksheet to record data. This activity is desgned for scientific probes, but can be adapted to meet your needs. Follow up in
the classroom by having students create
spreadsheets, graphs, and charts. What did they discover from
the data collected? |
|||||||||
|
|
|
 |
 |
||||||
|
Absorbing Answers Our young scientists
expertly created an Excel spreadsheet of the data collected from
pH and temperature samples. They constructed graphs and charts
of temperatures from the woodland, meadow, and stream so they
could compare the results and draw conclusions. Another chart
compared the different pH readings from each of the ecosystems.
They found that air temperatures were very similar for each location
and the difference between the surface temperature and the ground
temperature ranged between 4 and 5 degrees. The study that captivated
students the most was pH. They discovered that pH was more acidic
under trees in the woodland than in the open meadow and the stream
was somewhat acidic due to leaves falling into it. Each student
kept a folder and disk of the results to compare with those of
the next excursion in the winter. Who knows what science treasures
students will discover on their next outing. |
|||||||||
 |
Web Links Have you ever wondered how many years it takes to form one inch of soil? S.K. Worm answers frequently asked questions about soil in a humorous way. This site is brought to you by the United States Department of Agriculture and is geared to elementary students. Basic concepts about biomes and ecosystems around the world are presented along with photographs and illustrations. You can find facts and definitions about deserts, forests, grasslands, streams, wetlands, and oceans. The site is easy to navigate and suitable for elementary and middle school students. What do cabbage water and litmus paper have in common? Paper strips dipped in cabbage water and dried can be can be used as an indicator of pH. Predict the pH of substances, and then click on the item to see where it falls on the pH scale. In addition to activities and lessons, there is a clear explanation of water and pH. This is a great starting point for elementary and middle school students to learn about pH. Compare the air and soils temperatures your students gather with other areas of the country in real time. Sorting out relevant information may be a bit challenging at first because so much other data is included in the tables. However, once you understand the column codes, you will be able to find the information for your comparison study. All temperatures are reported in Celsius. High School students can take this a step further by comparing other soil data like moisture and salinity. GLOBE is a worldwide hands-on, primary and secondary school-based science and education program. The program offers students the opportunity to take measurements and report their data through the Internet. Teachers can take advantage of the many teaching guides, Web chats, and videos on scientific topics. All GLOBE texts and other materials can be downloaded or copied without charge. The materials on soil investigation are comprehensive and include activities that teachers can implement readily into the curriculum. From Bricks to Mud Pies, A Field View of Soil – Digging Around, and Soil the Great Decomposer are a sample of the activities covered. Teachers and other educators who wish to lead students in GLOBE need to attend special workshops in order to fully participate in the program. Soil Facts -- definitions of soil and soil survey, information on careers, some basics on soil formation and classification, soil science glossary, and regulations for moving soils Water Quality Program: Streams Why is the temperature of a stream important? How does pollution affect the pH in water? These and other questions are answered. Nutrients, dissolved oxygen, suspended solids and turbidity, are also presented. Where to Buy Science Probes
Although the students in this article used the Pasco Datalogger and sensors, there are several companies that manufacture probeware for schools. Many of the products are sold in bundles targeted to specific grade levels and subject areas. Pasco Vernier
|
|||||||||
|
||||||||||
Updated March 14, 2015
© 1996 - 2015 Linda C. Joseph and Linda D. Resch
All Rights Reserved
All CyberBee Graphics are Trademarked
Graphics by
Darlene Vanasco/Creative Director
Erika Taguchi/Designer & Illustrator
Hosting Provided by Iwaynet